Overview
These dashboards serve as dynamic windows into the heart of HVHD’s operations, capturing the essence of their commitment to community well-being. With a seamless blend of data analytics and user-friendly design, the dashboards offer real-time insights into the range of services HVHD offers. By transforming complex data into easily digestible graphs, charts, and visual aids, the dashboards empower stakeholders, community members, and partners to grasp the depth and impact of HVHD’s efforts at a glance.
Dashboard topics include Environmental Health Building and Septic Overview, 2022 HVHD Flu Clinic Overview, and much more to come.
Environmental Health Dashboards
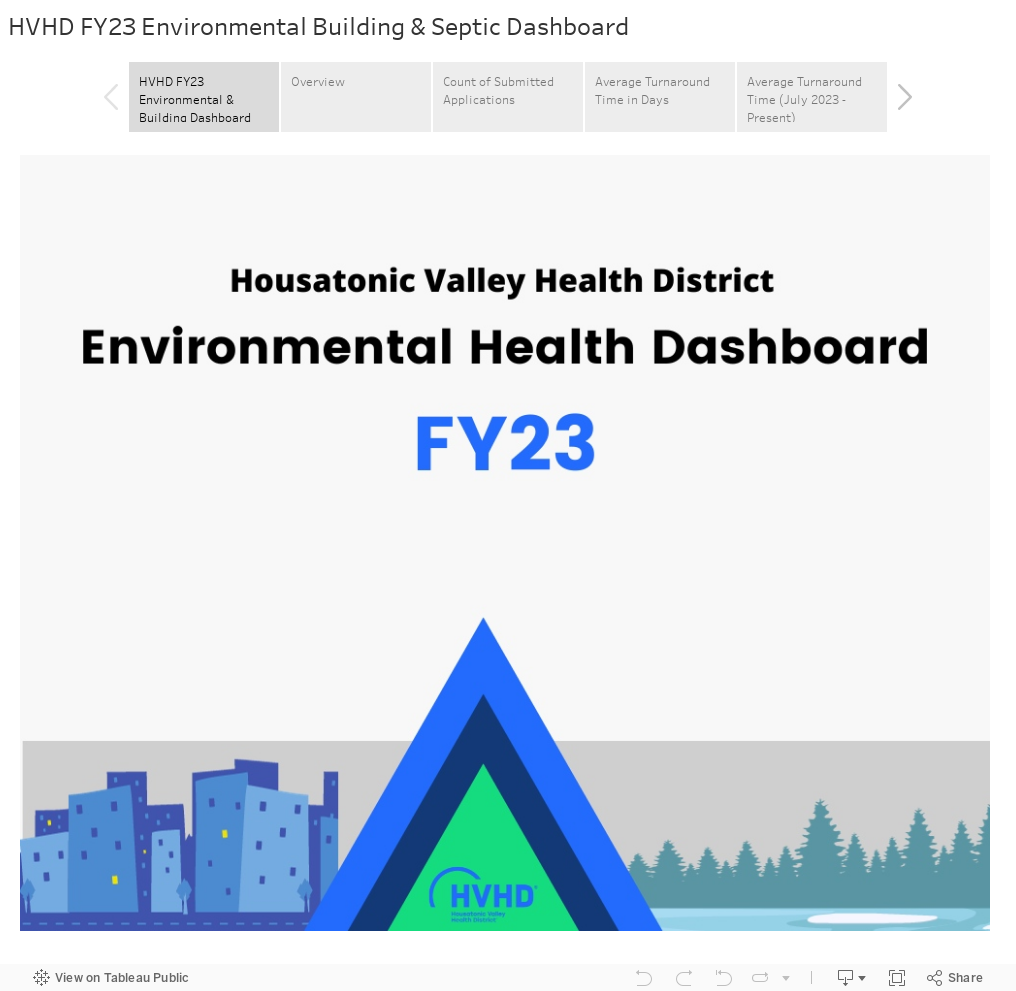
Updated: April 29, 2024
Community Health Dashboards
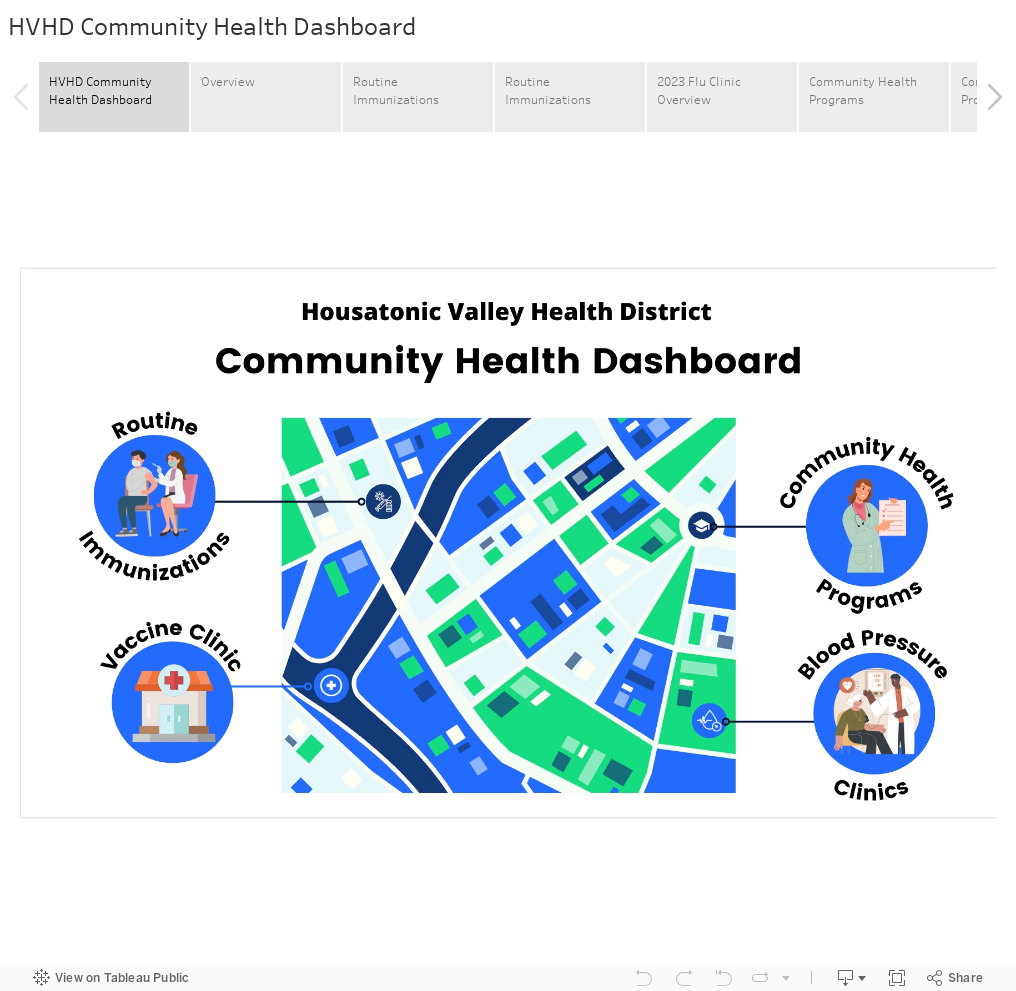
Updated: April 29, 2024
HVHD Community Profile Dashboard
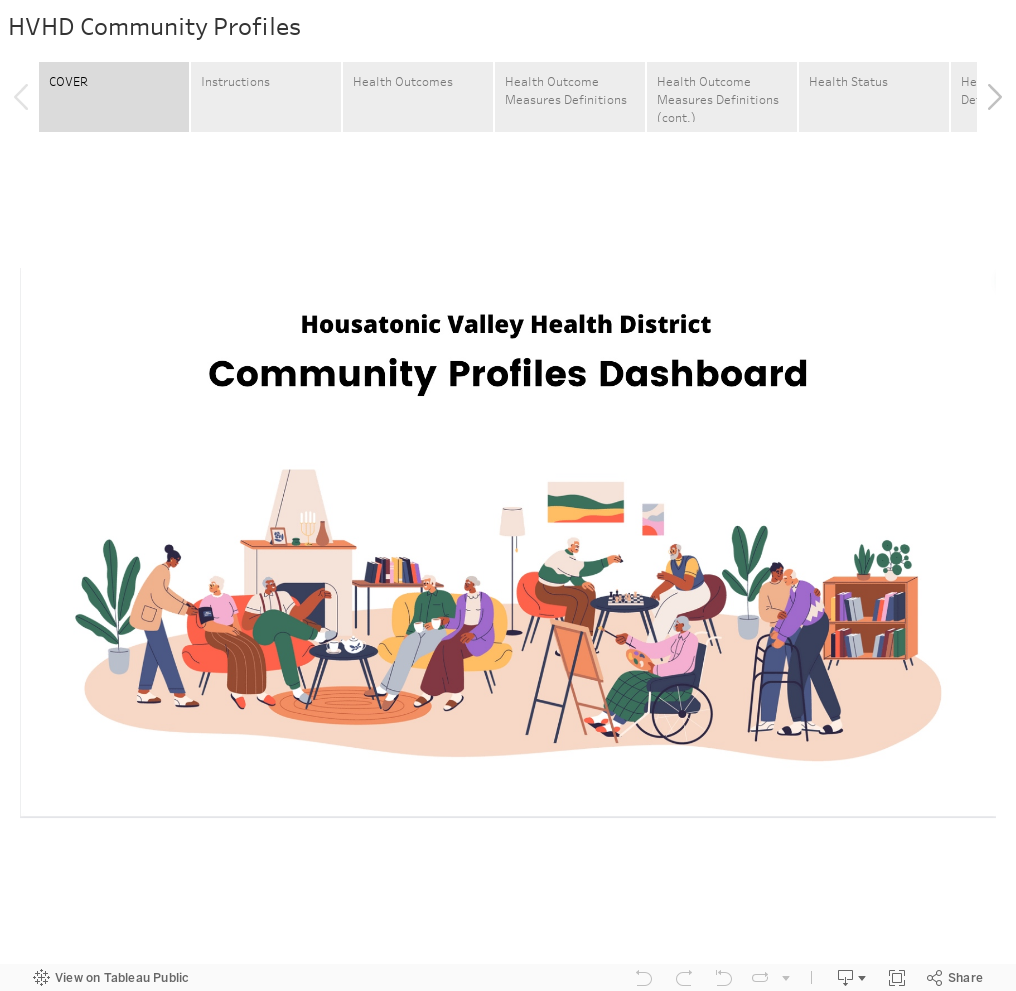
Updated: May 6, 2024
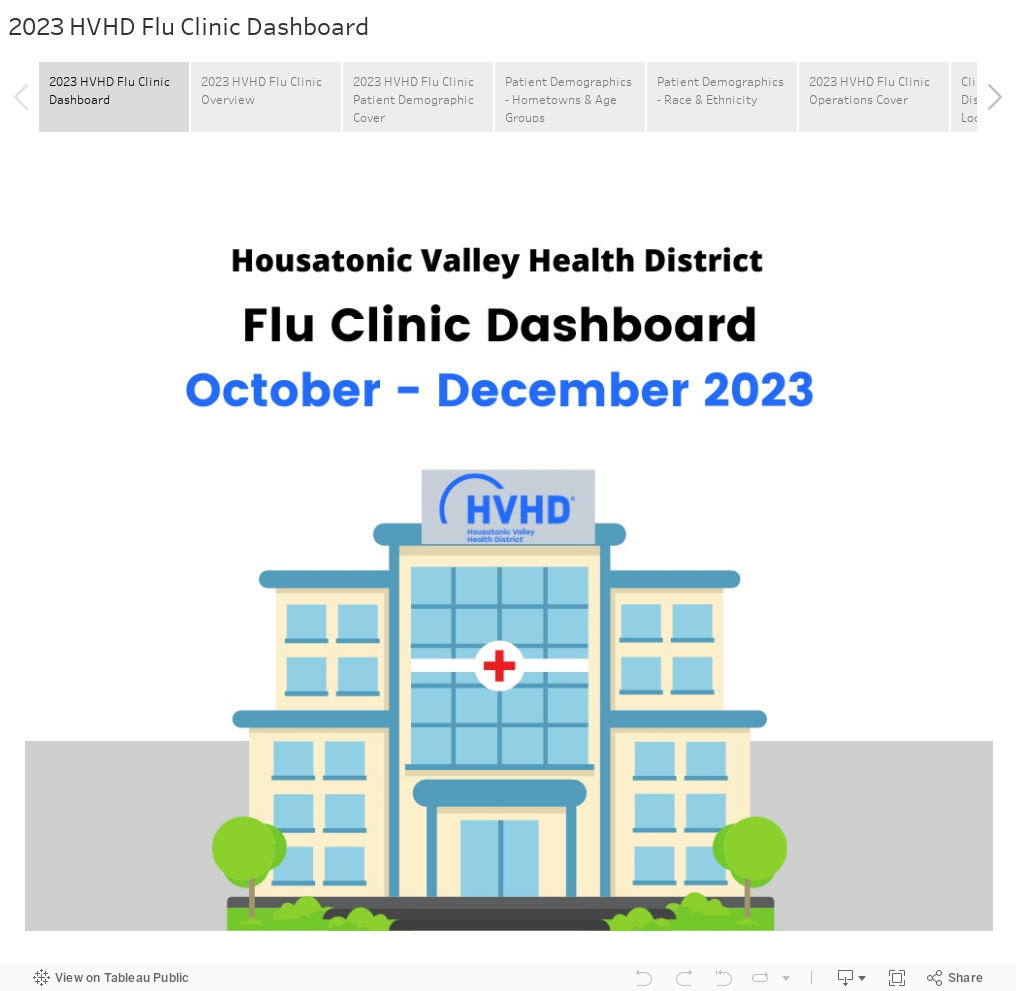
2023 HVHD Flu Clinic Dashboard
Created: January 30, 2024
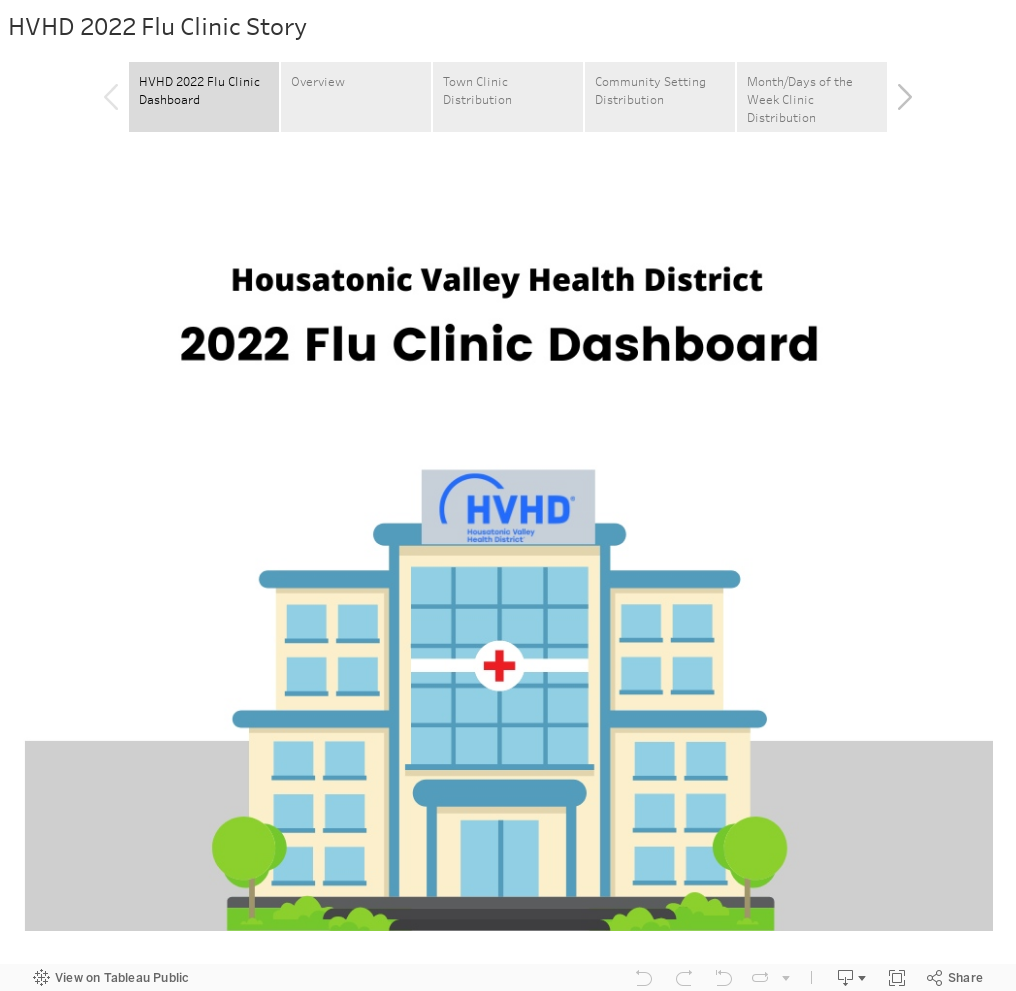
2022 HVHD Flu Clinic Dashboard